At the beginning of this project, I had no idea in mind as to what I wanted to be researching. Many topics came to mind, but the results were not as successful as I had hoped. Finally, I came across a topic that sparked an interest; summer lunches served to students and how much government money is spent.
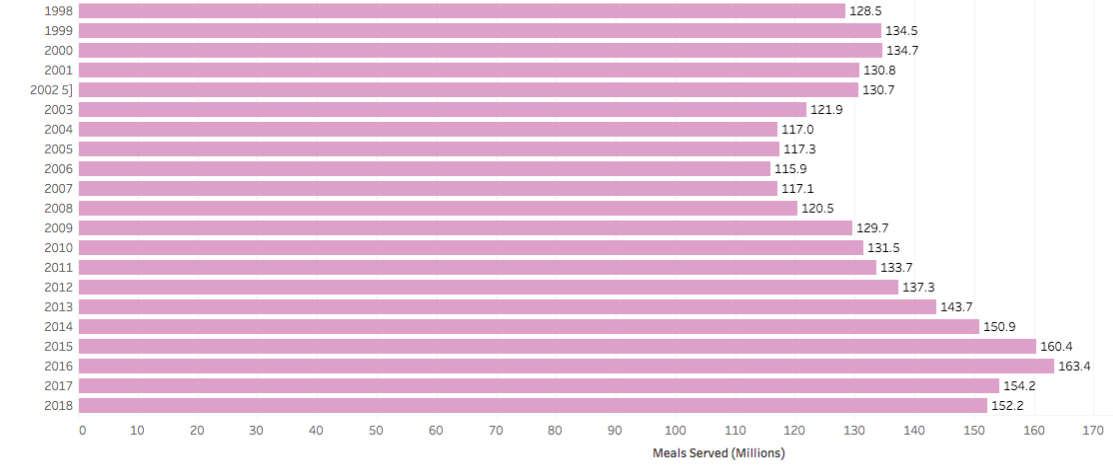
Looking into this topic, I knew some stipulations in order for students to qualify for the program, such as low income. These students would receive free or reduced lunches throughout the school year. 80% of the students at the school district that I currently teach for qualified for free or reduced lunches, so the statistic of lunches served was no surprise to me. In 2018 alone, 152.2 million summer lunches were served to students in grades PreK-12. The chart below shows how meals served have fluctuated thought the last twenty years but it is on a consistent rise.
https://catalog.data.gov/dataset/summer-food-service-participation-meals-and-costs-data
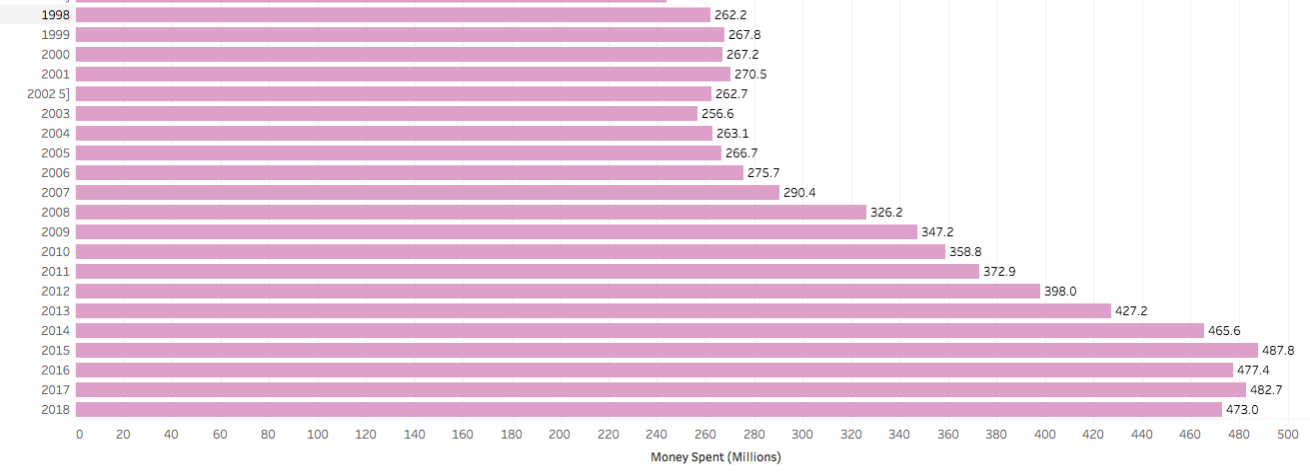
One aspect that did surprise me was the amount of government money that is spent on just summer lunches alone. The highest it has even been was in 2015 where 488 million dollars were spent on summer lunches to students who are eighteen years old and younger. Seventeen years earlier only 262 million dollars were spent, almost half of what was spent in 2015.
https://catalog.data.gov/dataset/summer-food-service-participation-meals-and-costs-data
While the prices of summer school lunches did surprise me, what surprised me the most was how many students qualified and accepted free or reduced school lunches compared to those who accepted summer lunches. “During the school year, 22 million children receive free or reduced-priced meals through the National School Lunch Program. When school is out during the summer months, however, only 3.76 million receive free or reduced-price meals through the USDA Summer Food Service Program” (Feed America, 2018). While they may be barriers that prevent students from receiving these meals (ex. parent(s)/guardian at work, no ride, etc.), we need to be cautiously aware that they are available to our students.
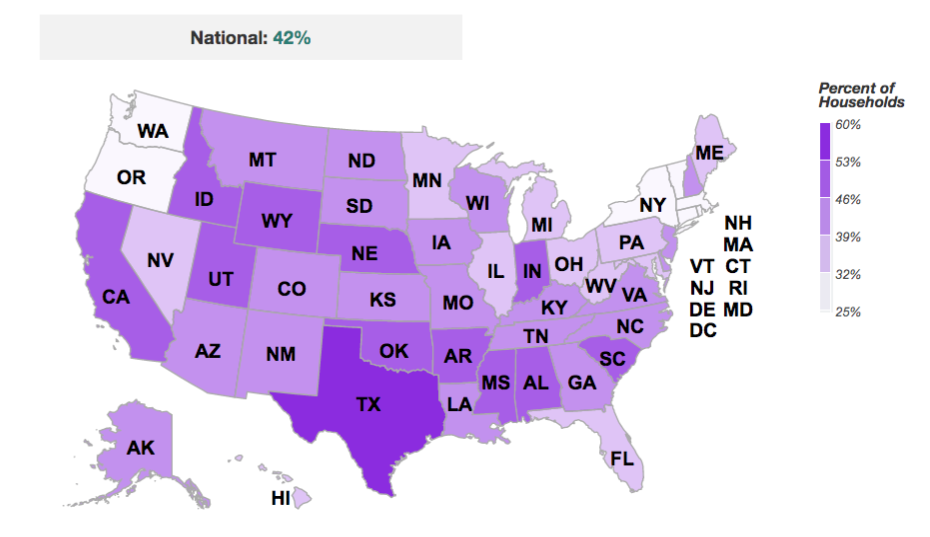
After looking at these graphs, I wanted to know how many households in the United States qualified for free or reduced lunches. While the national number of all who receive assistance is much higher, I wanted to specifically focus on children ages eighteen years old and younger. According to Food and Nutrition Service, United States Department of Agriculture, in 21017 more than 40% of household nationally qualify for Supplemental Nutrition Assistance Program (SNAP) (US Department of Agriculture, 2019). This is for households with children under the age of eighteen.
One can also see from the next graph that there is correlation between individuals who live in poverty and who qualify for the SNAP assistance program. The black dots represent individuals who receive assistance from SNAP, and the green squares represent individuals in poverty.
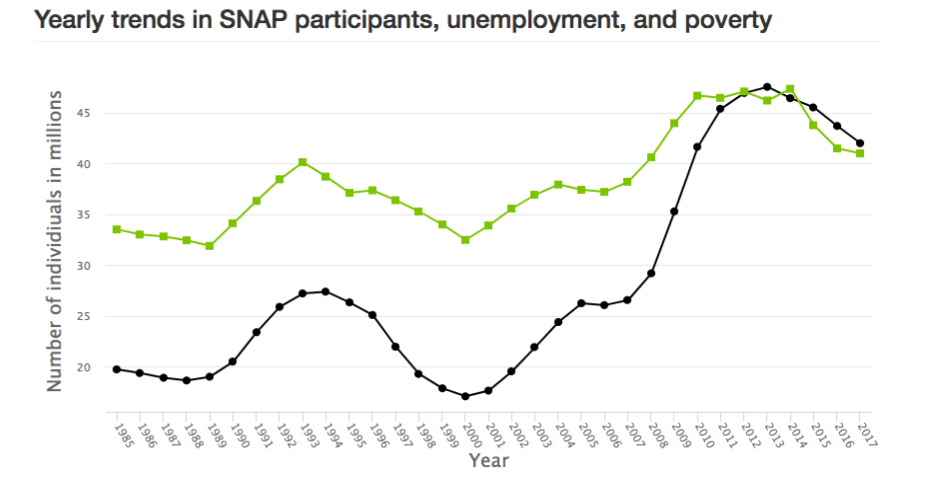
As one can see, when poverty took a uphill turn around the year 2000, the number who reached out for assistance from SNAP also began to rise. Around the year 2011 is when the numbers began to be even. One alarming visual from this graph is that even though poverty level is beginning to decline slightly, the number of individuals who seek out SNAP assistance still raises above poverty level.
Conclusion
As educators, we have to look at the barriers that these students are coming to us with. Hunger is a roadblock for many students and how can we expect them to learn if all they are thinking about is when their next meal is coming. We need to encourage students to utilize the summer meal programs so that they come to use ready to go.
Full Information for the graphs from Tableau Public (dating back to 1969) are available using the following links:
Money Spent on Summer Lunches: https://public.tableau.com/profile/alison.weltmer#!/vizhome/MoneySpentonSummerLunches/Sheet2
Number of Summer Lunches Served: https://public.tableau.com/profile/alison.weltmer#!/vizhome/SummerLunchesServed/Sheet1
References
Data visualizations: SNAP households characteristics and participation rates. (2019). Food and Nutrition Service, US Department of Agriculture. Retrieved from https://www.fns.usda.gov/data-visualizations-snap-household-characteristics-and-participation-rates
Summer food service participation, meals, and cost data. (2019). Food and Nutrition Service, US Department of Agriculture. https://catalog.data.gov/dataset/summer-food-service-participation-meals-and-costs-data
Summer food service program. (2018). Feeding America. Retrieved from https://www.feedingamerica.org/our-work/hunger-relief-programs/summer-food-service-program
 Alison's Blog